Tri-Cities Real Estate Market Update, December

The end-of-2013 Tri-Cities real estate market information has just been released. Comparing December 2012 with December 2013 note that although median sales price decreased just a bit, the number of homes under contract and sold have seen significant gains.

2013q4update1

The numbers as a whole represent a year of modest growth. Below is the number of homes available on the market for both 2012 and 2013. As you can see, in April 2013, the number of homes available in the Tri-Cities began to decline. A smaller supply of homes with steady demand will cause home prices to increase, in this case modestly.

2013q4update2

The below graph represents median home prices in the Tri-Cities over 2012 and 2013. Note that the 2013 line is almost consistently over the 2012 line, representing a small increase over 2012.

2013q4update3

If you are interested in hearing more about our market, please give us a call: Jessica at (509) 947-2230 or Jennifer at (509) 947-5670.

Tri-Cities Real Estate Market Update, October

The September and October Tri-Cities real estate market information is hot off the presses! This has been another two months of modest growth over the previous year.

The below chart shows the data comparing September of 2012 and September of 2013.

sepmarketcomp01

The October data is also newly-available:

octmarketcomp01

According to the National Association of REALTORS®, the Kennewick-Richland-Pasco metro area is seeing a upward trend in new home construction with 1,661 current building permits through June 2013. This is 36.7% above the long-term average of 1,215 permits.

Did you know that the Tri-Cities is only behind Seattle and Portland for the number of building permits in Washington and Oregon? In August, 2013, Seattle issued 6300 permits, Portland issued 3970 permits and Kennewick-Richland-Pasco issued 1000 permits. New construction is strong in our area.

If you are interested in hearing more about our market, please give us a call: Jessica at (509) 947-2230 or Jennifer at (509) 947-5670.

Sources

Tri-Cities Real Estate Market Update

The August numbers have been released from the MLS and we have seen modest growth. Median Home Sale prices have increased over 7% over August 2012 numbers. The number of homes under contract also increased slightly by .84%. Our inventory has seen an adjustment as well, with a 5.1% decline.

The below chart shows the data comparing August of 2012 and August of 2013.

2013 Q3 Market Update 1

One reason the real estate market is showing moderate growth is due to our steady employment. The below graph shows the unemployment rate for the Tri-Cities Metropolitan Area which includes Kennewick, Richland, and Pasco. As you can see, year over year, our employment rate has been steady. We do see a slight spike in the winter as part of our economy is agriculturally based.

2013 Q3 Market Update 2

If you are interested in hearing more about our market and how it impacts your property, please give us a call: Jessica at (509) 947-2230 or Jennifer at (509) 947-5670.

Tri-Cities Real Estate Market Update – Second Quarter 2013

The second quarter (plus July) numbers are available from the MLS. Our second quarter number of homes sold is up significantly over 2012 with 893 homes sold in 2013 versus 815 in 2012. The number of homes on the market has also decreased (1392 homes on the market in July of 2013 versus 1456 homes on the market in July of 2012), meaning demand for the homes that are on the market has increased. An increase in demand results in an increase in price. Comparing July of 2012 versus 2013, average sales prices are up 2.6%.

The number of homes under contract is also up over last year significantly. Comparing July 2012 versus July 2013, the number of homes under contract have increased 26.2%. The first seven months of 2013 pendings were up an average of 13.48%.

inventory+solds 2012-2013

According to the Tri-City Development Council, between the 2010 Census and 2013 estimates, the population has increased in this area about 5,000 per year. Remember, people need a place to live!

Rising Interest Rates and Homeowners – What You Need To Know

00014474According to Bankrate.com, 30 year mortgage interest rates were at 4.74% week before last from 4.57% the week before) and are up 1.5% since the lows hit in December of 2012. This is also higher than one year ago when mortgage rates were 3.91%.

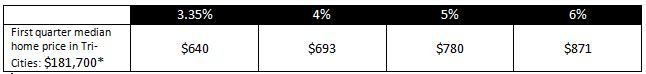
While this may not seem like a significant increase, it can have an impact on buying power. For example, on a $200,000 loan, the change in interest rates from 3.91% to today’s 4.74% is $98 more per month or $35,280 over the life of the loan.

Interest rates are expected to continue to rise which has caused some buyers who were previously on the fence to get into the buyer pool now to the delight of sellers. If you have been considering selling your current home and moving to something larger, in a better location, or something with higher-quality finishes, this would classify you as a “move-up buyer” and rising interest rates may affect you more than other types of seller/buyers. Here’s why:

First-time homebuyers don’t have a home to sell. Their buying power certainly ties into interest rates, but the financial impact is less when the loan amount is lower. For example, on that $200,000 loan example above, the difference was $98 more per month. However, on a loan of $140,000, that difference is lessened to $68 per month.

Downsizing buyers may be saving per month after downsizing as they may be using the equity in the more-expensive home they are selling to put a larger down payment on the home they are downsizing to. For example, let’s say a retired couple is selling their home they have lived in for 15 years. They will be selling it for $300,000 and have $100,000 in equity in it. They plan on buying a home for $209,000 and they are putting their $100,000 as a down payment, leaving them with a loan amount of only $109,000. The difference between 3.91% and 4.74% for this loan amount is $53 per month.

However, the downsizing buyer still needs to sell their home. As interest rates rise, the number of buyers who can buy their home at that price will shrink. Therefore, downsizing buyers do still need to watch rates.

The move-up buyer needs to keep a close eye on interest rates as they are considering their move. For example, let’s say the move-up buyer has a home they are going to sell for $200,000 and they want to buy a home that is listed for $300,000. In this case they have about $50,000 in equity in the first home. This means they will take out a loan of about $250,000 for their move-up property.

If interest rates go up as in the 3.91% to 4.74% example, this can affect the move-up buyer two-fold. First, the buyer pool for their home they are trying to sell will shrink, making it more difficult for them to sell (although it can be argued that the same thing will happen with the home they wish to purchase) Second, the amount they would need to pay each month for their mortgage will increase (by $122 per month!)

The bottom line? If you are thinking about buying or selling, interest rates will definitely have an impact on the home you can purchase and how many buyers are available to purchase your home if you are trying to sell. Move-up buyers should consider the number of buyers who are in the market right now, wanting to buy, as this could be a great time to sell and find a great deal at a good interest rate. But time is of the essence. Please call us to learn your options and what moving now versus moving later could look like. Please call Jessica at (509) 947-2230 or Jennifer at (509) 947-5670.

All mortgage examples are for a 30 year fixed rate mortgage and payment amounts include principal and interest only. Downpayments, homeowners insurance, property taxes, private mortgage insurance, closing costs, etc have not been factored into these examples.

Interest Rates

We have been getting a lot of inquiries lately about interest rates. As you may or may not know, interest rates have been quietly creeping up since December of 2012. At that time, the rates for a 30 year fixed rate mortgage were at a record of 3.35%. The last few weeks, however, rates have been hovering around 4% or more for the first time since November of 2011. Just how much of a difference can this .65% increase make? You might be surprised!

Below is a table which illustrates the corresponding monthly payment for a home purchased at our first quarter, 2013 median home price of $181,700. This assumes a 20% down payment with principle and interest only on a 30 year fixed rate mortgage.

interest-rates-example

If you are in the market for a home and you see that mortgage interest rates have gone up a small fraction of a percent, is that cause to panic and change direction? Of course not, but if you are in the market for a home, it does make sense to establish a close relationship with a lender right away who can quickly spot interest rate trends and get you “locked in” if conditions are favorable and you are within days or hours of submitting your loan application.
Do you see how just by waiting six months can diminish a buyer’s buying power? The difference between 3.35% and 4% is $53 a month or over $19,000 over the life of the loan!

Currently, the rates are being kept artificially low due to the government buying bonds in an effort to stimulate the economy. However, with the economy growing stronger, the Federal Reserve is expected to cut back on buying bonds, causing rates to rise. Chief Economist for the National Association of REALTORS®, Lawrence Yun, predicts interest rates could go as high as 5% by the end of the year. At our median home price of $181,700, that could equate to a monthly payment of $87 more per month than where rates are right now – or $31,320 over the life of the loan.

If you think you may be on the move in the coming weeks or months, give us a call. We can provide you scenarios based on interest rates now and what your situation may look like with different interest rates in place so you can make informed decisions. Please give us a call – Jessica (509) 947-2230 or Jennifer (509) 947-5670.

Source: http://www.forbes.com/sites/morganbrennan/2013/06/05/how-rising-mortgage-rates-could-affect-the-housing-recovery/

Tri-Cities Real Estate Market Update First Quarter 2013

The National Association of REALTORS® has released their market statistics for the Kennewick-Richland-Pasco area first quarter 2013. Our area did see a modest increase in median home prices year over year (comparing quarter 1 of 2012 with quarter 1 of 2012) of 2.3%, putting our median home price at $181,700.

Nationally, median home prices rose 11.2% comparing quarter 1 2012 with quarter 1 2013, but remember, many areas of the country saw big declines between 2009-2011 and are still not back up to pre-recession levels. In fact, the National Association of REALTORS® also tracks “Housing Equity Gain” which reflects price appreciation over 3,7, and 9 year terms. The 7-year Housing Equity Gain for the US total is still -$40,867 although Kennewick-Richland-Pasco reports a 7 year Housing Equity Gain of +$29,700.

The below graphs indicate the snapshot of monthly inventory (number of homes on the market) for 2012 vs the first few months of 2013. Our inventory has remained fairly consistent with last year.

marketupdate-201306

The below chart illustrates the year over year number of solds in the Tri-Cities comparing 2012 with 2013. The number of solds so far this year is 900, which is modestly above the 807 sold year-to-date in 2012.

marketupdate-201306-2

Additionally, NAR tracks building permits. Compared to the previous year (which is actually a sum of the past 12 months of building permits issued), single family housing permits are up 28.4%. (as opposed to 25.6% nationally). This indicates construction is on the rise, which is an indicator that inventory levels have stabilized.

If you have questions on what these figures mean to you, please don’t hesitate to give us a call. You can reach Jennifer Cowgill at (509) 947-5670 or Jessica Johnson at (509) 947-2230.

Sources:

http://www.realtor.org/sites/default/files/reports/2013/local-market-reports-2013-q1/local-market-reports-2013-q1-WAKennewick.pdf

http://tcarmls.com/wp-content/uploads/2013/05/STATS-FOR-2010-2013-MEDIAN.pdf

Tri-Cities Real Estate Market Update

The fourth quarter numbers are out from the Washington State Center for Real Estate Research. Median resale prices are up 8.3% over the previous year as are the number of sold properties.

  Resales % change from
last quarter
% change from
last year
Median Resale Price % change from
last year
Benton County 3,100 +2.6% +.3% $189,300 +8.3%
Franklin County 640 +3.2% +1.6% $189,300 +8.3%

*Numbers are seasonally adjusted

The below lines represent the past year’s inventory and homes under contract. As the lines get closer together, this represents the housing inventory being consumed at a faster pace (in other words, demand for housing has increased). As the lines get further apart, this represents a surplus of inventory. As you can see, our inventory levels are lower than this summer, but are not quite as low as they were last January, but the number of homes under contract is a bit higher than the number of homes under contract last January.

Feb 2013 Tri City Market Update

Spring is right around the corner, and we are excited for things to come. If you have been thinking of buying or selling this spring, let’s set up some time to discuss your plans and create a strategy. Please call Jennifer at (509) 947-5670 or Jessica at (509) 947-2230.

Sources: http://wcrerdata.be.washington.edu/WSHM/2012Q4/Snapshot%204Q%202012%20v2.pdf and the Tri-City Association of REALTORS®.